Top Indian Youtubers 2024
Objective
The Head of Marketing wants to find out who the top YouTubers are in 2024 to decide on which YouTubers would be best to run marketing campaigns throughout the rest of the year.
- What is the ideal solution?
To create a dashboard that provides insights into the top Indian YouTubers in 2024 that includes their
- subscriber count
- total views
- total videos, and
- engagement metrics
This will help the marketing team make informed decisions about which YouTubers to collaborate with for their marketing campaigns.
User story
As the Head of Marketing, I want to use a dashboard that analyses YouTube channel data in the India.
This dashboard should allow me to identify the top performing channels based on metrics like subscriber base, average views, activeness on youtube and engagement metrics of the youtuber.
With this information, I can make more informed decisions about which Youtubers are right to collaborate with, and therefore maximize how effective each marketing campaign is.
Data source
- What data is needed to achieve our objective?
We need data on the top Indian YouTubers in 2024 that includes their
channel names
total subscribers
total views
total videos uploaded
Where is the data coming from?
The data is sourced from Kaggle (an Excel extract), see here to find it.
Other necessary data is extracted from Youtube Data API with python.
Stages
- Design
- Developement
- Testing
- Analysis
Design
Dashboard components required
- What should the dashboard contain based on the requirements provided?
To understand what it should contain, we need to figure out what questions we need the dashboard to answer:
- Who are the top 10 YouTubers with the most subscribers?
- Which 3 channels have uploaded the most videos?
- Which 3 channels have the most views?
- Which 3 channels have the highest average views per video?
- Which 3 channels have the highest views per subscriber ratio?
- Which 3 channels have the highest subscriber engagement rate per video uploaded?
For now, these are some of the questions we need to answer, this may change as we progress down our analysis.
Dashboard mockup
- What should it look like?
Some of the data visuals that may be appropriate in answering our questions include:
- Table
- Treemap
- Scorecards
- Horizontal bar chart
Tools
| Tool | Purpose |
|---|---|
| Excel | Exploring the data |
| MySQL | Cleaning, testing, and analyzing the data |
| Tableau | Visualizing the data via interactive dashboards |
| GitHub | Hosting the project documentation and version control |
Development
Pseudocode
- What's the general approach in creating this solution from start to finish?
- Get the data
- Explore the data in Excel
- Load the data into MySQL
- Clean the data with SQL
- Test the data with SQL
- Visualize the data in Tableau
- Generate the findings based on the insights
Data exploration notes
This is the stage where you have a scan of what's in the data, errors, inconcsistencies, bugs, weird and corrupted characters etc
- What are your initial observations with this dataset? What's caught your attention so far?
- There are at least 4 columns that contain the data we need for this analysis, which signals we have everything we need from the file without needing to contact the client for any more data.
- The first column contains the channel ID with what appears to be channel IDS, which are separated by a @ symbol - we need to extract the channel names from this.
- Some of the cells and header names are in a different language - we need to confirm if these columns are needed, and if so, we need to address them.
- We have more data than we need, so some of these columns would need to be removed
Data cleaning
- What do we expect the clean data to look like? (What should it contain? What contraints should we apply to it?)
The aim is to refine our dataset to ensure it is structured and ready for analysis.
The cleaned data should meet the following criteria and constraints:
- Only relevant columns should be retained.
- All data types should be appropriate for the contents of each column.
- No column should contain null values, indicating complete data for all records.
Below is a table outlining the constraints on our cleaned dataset:
| Property | Description |
|---|---|
| Number of Rows | 100 |
| Number of Columns | 4 |
And here is a tabular representation of the expected schema for the clean data:
| Column Name | Data Type | Nullable |
|---|---|---|
| channel_name | VARCHAR | NO |
| total_subscribers | INTEGER | NO |
| total_views | INTEGER | NO |
| total_videos | INTEGER | NO |
- What steps are needed to clean and shape the data into the desired format?
- Remove unnecessary columns by only selecting the ones you need
- Extract Youtube channel names from the first column
- Rename columns using aliases
Visualization
Results
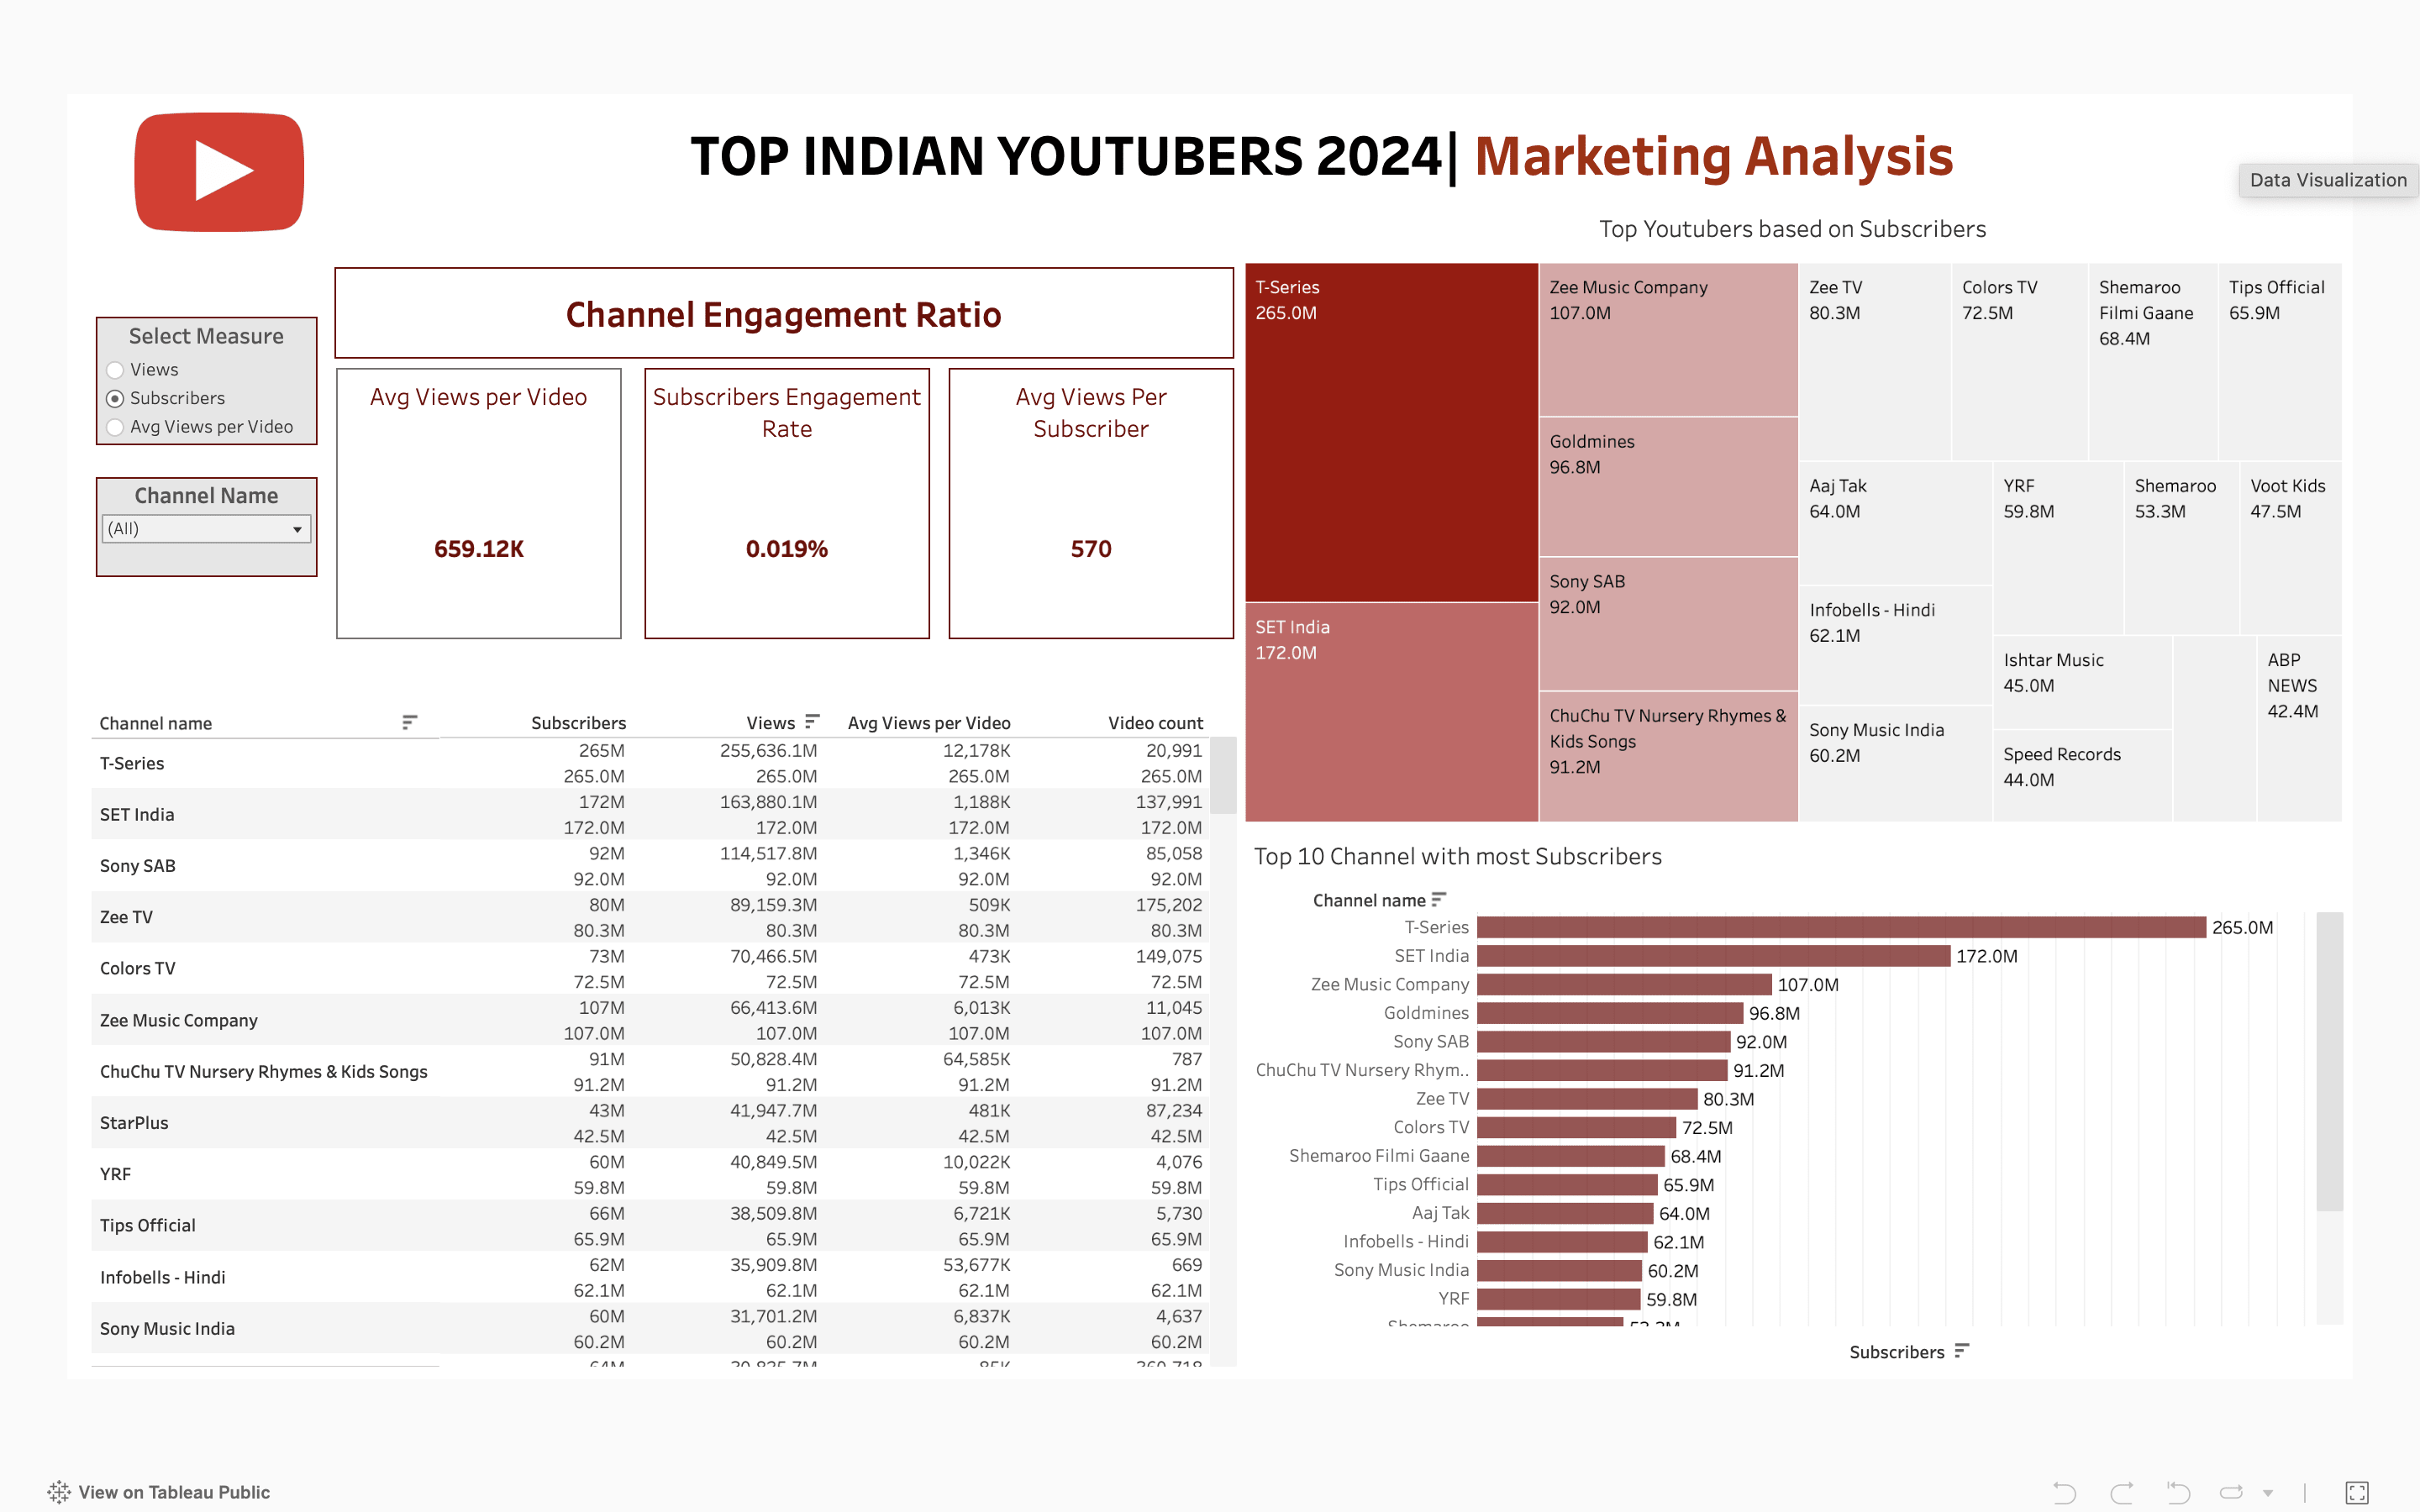
- What does the dashboard look like?
https://public.tableau.com/views/TopIndianYoutubers2024/Dashboard1?:language=en-US&:sid=&:display_count=n&:origin=viz_share_link
This shows the Top Indian Youtubers in 2024 so far.
Analysis
Findings
- What did we find?
For this analysis, we're going to focus on the questions below to get the information we need for our marketing client -
Here are the key questions we need to answer for our marketing client:
- Who are the top 10 YouTubers with the most subscribers?
- Which 3 channels have uploaded the most videos?
- Which 3 channels have the most views?
- Which 3 channels have the highest average views per video?
- Which 3 channels have the highest views per subscriber ratio?
- Which 3 channels have the highest subscriber engagement rate per video uploaded?
Notes
For this analysis, we'll prioritize analysing the metrics that are important in generating the expected ROI for our marketing client, which are the YouTube channels wuth the most
- subscribers
- total views
- videos uploaded
28 May 2024


