Operations Analysis and Investigating Metrics of Job Data
Project Title: Operational Analysis and Investigating Metrics of a Company's Job Data
Objective:
Operational Analytics is a crucial process that involves analyzing a company’s end-to-end operations in order to identify areas for improvement within the company. One of the key aspects of Operational analytics is investigating metric spikes i.e., understanding and explaining sudden changes in key metrics.
In this project we aim to derive insights from the job_data and email_events data set and answers questions posed in the given case studies.
Analysis and Insights:
Job Data Analysis:
- The number of jobs reviewed per hour indicates the efficiency of the reviewing process. From the dataset we can see that the cumulative average of reviewing jobs per hour is more than 200.
- The preference between daily metric and 7-day rolling average depends on the specific needs and objectives of the analysis. For short-term variations and daily patterns – Daily Metric is the best option. For understanding long-term trends and overall performance – Rolling-average is the best option.
- The percentage share of each language over the last 30 days highlights the popularity of different languages among users. The fact that Persian language has the highest share suggests a significant user base or preference for content in Persian.
- The absence of duplicate rows in the dataset ensures data integrity and accuracy in analysis. It indicates that each record represents a unique event or occurrence, allowing for reliable calculations and insights derived from the dataset.
Investigating Metric Spike:
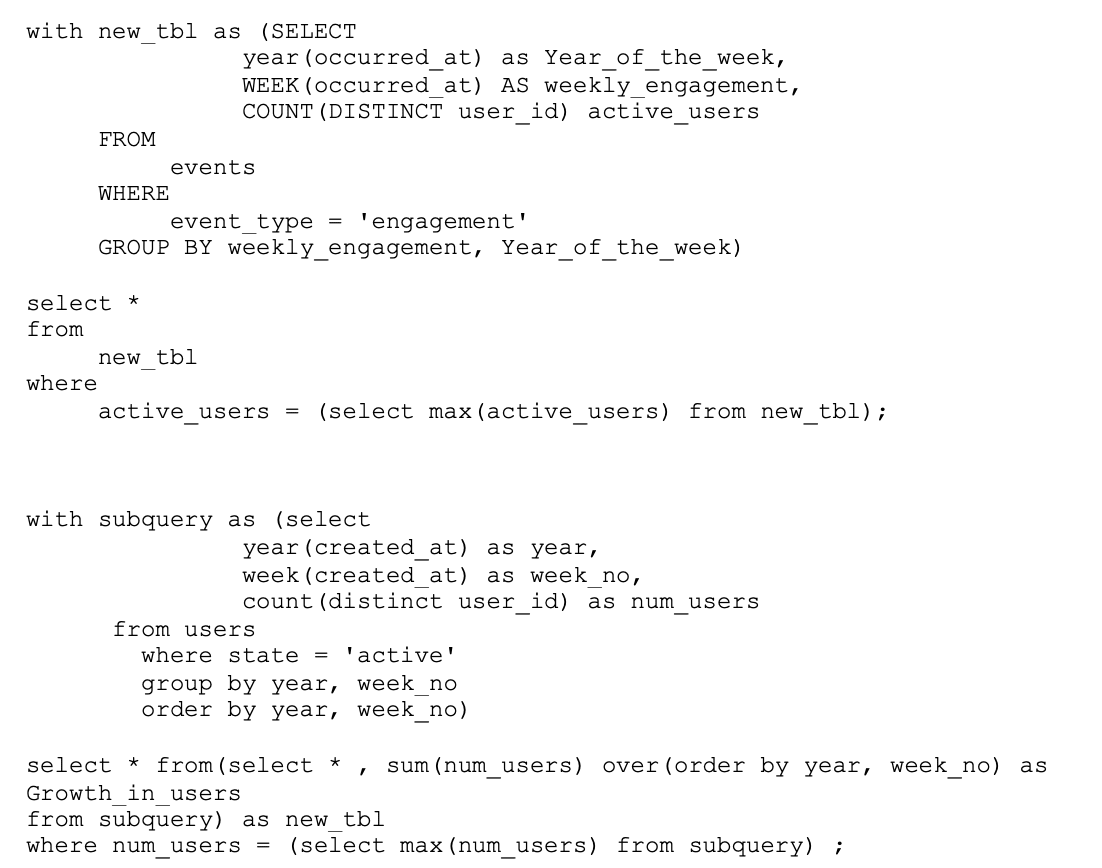
- Highest weekly Engagement was in the 30th week of 2014, with 1467 users. Knowing when users are most active helps plan events or updates.
- In the 33rd week of 2014, there was a surge in new users, with 261 joining. Identifying such growth periods can help target marketing efforts for maximum impact.
- Three users (IDs: 11816, 11863, 11928) remained engaged for 17 weeks, showing they really like the product. This indicates good retention efforts and overall satisfaction.
- Besides that total engaged_users were 10534 and retained users were 6854 shows we need new strategies to retain more users.
- Macbook Pro had the most user engagement in a week, with 322 users. This shows it's a favorite device among users, which can guide product development.
- The email open rate was 33.58%, indicating room for improvement in email content or subject lines. The click-through rate was 14.79%, suggesting the email content or call-to-action could be more compelling. Optimizing these factors can increase engagement and conversions.
Tools Used: MySQL Workbench 8.0, MS Excel 2019
Dataset Details:-
• Domain: HR Analytics
• Datasets: email_events.csv, events.csv, users.csv & job_data.csv
• Dataset Type: CSV
• Dataset Size: CSV file has 300k+, 90K+, 10K+ records respectively.(Total 400k+ records)
https://drive.google.com/file/d/1lTQBEVhaZdnK8lIfp6CAEe8uMbYcz26d/view?usp=sharing
31 Mar 2024