E-commerce Dashboard- using Power BI
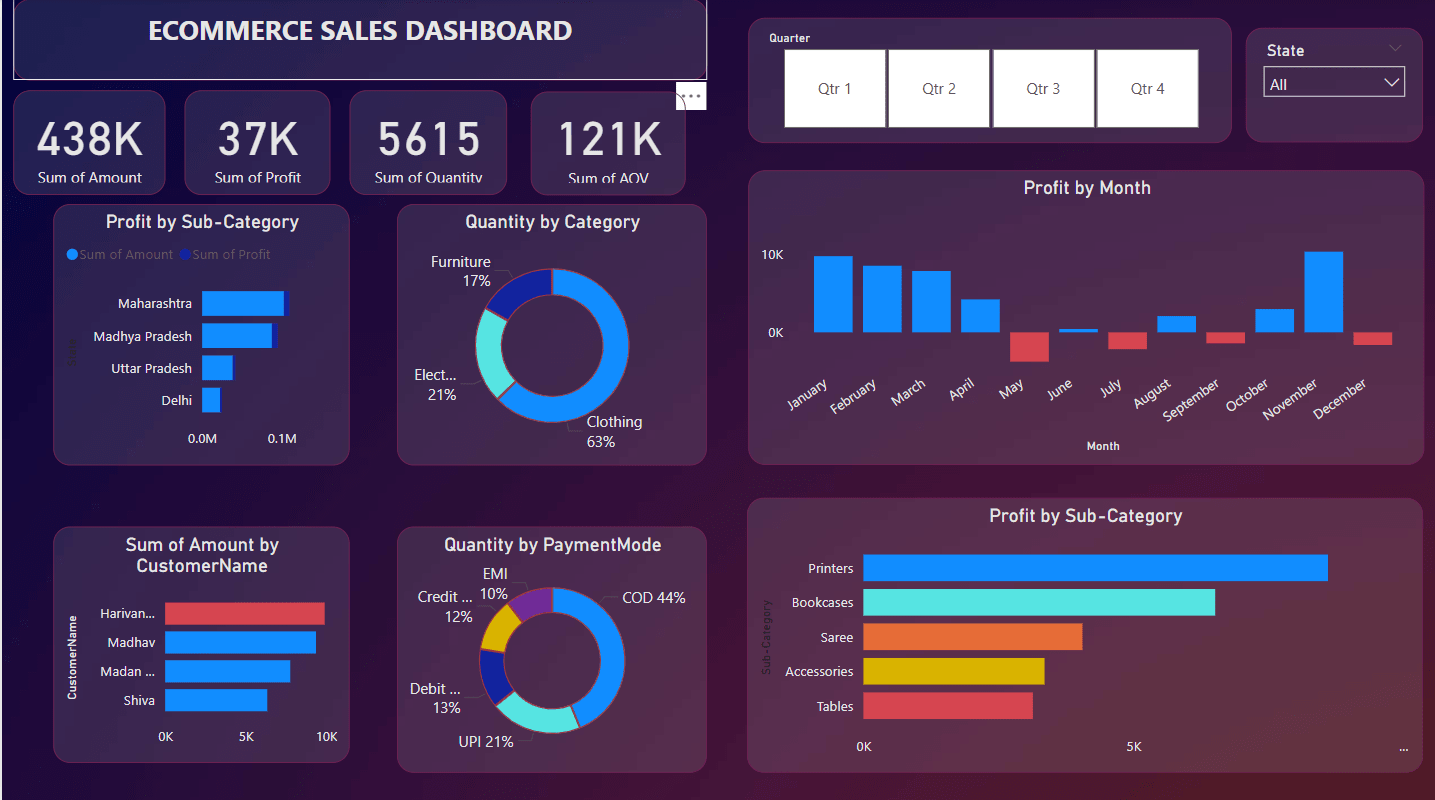
I'm thrilled to present my latest data visualization project: a comprehensive and interactive Power BI dashboard designed to monitor and analyze key sales performance metrics across multiple business dimensions.
🛠 Tools Used: Power BI, Power Query, DAX
📈 Sales & Profit Analysis
Dive into real-time insights on revenue, profit, and order performance with dynamic KPIs and intuitive charts that highlight business health at a glance.
👥 Customer Segmentation
Uncover trends by segmenting customers based on purchasing behavior and profitability, helping stakeholders identify top-performing demographics.
🌍 Regional Performance
Compare sales across different regions using a map-based visualization and bar charts to reveal high-performing areas and growth opportunities.
🧮 Calculated Metrics with DAX
Leverage powerful DAX formulas to compute essential business indicators such as total sales, average order value, and profit margin, ensuring accurate decision-making.
🔄 Data Transformation with Power Query
Efficiently cleaned and shaped raw sales data for analysis, ensuring reliability and consistency across all visual elements.
This Power BI project offered a rich experience in data modeling, KPI development, and interactive dashboard design, providing business leaders with a strategic lens to track performance and drive growth.
18 Jun 2025