Sales Power BI Dashboard
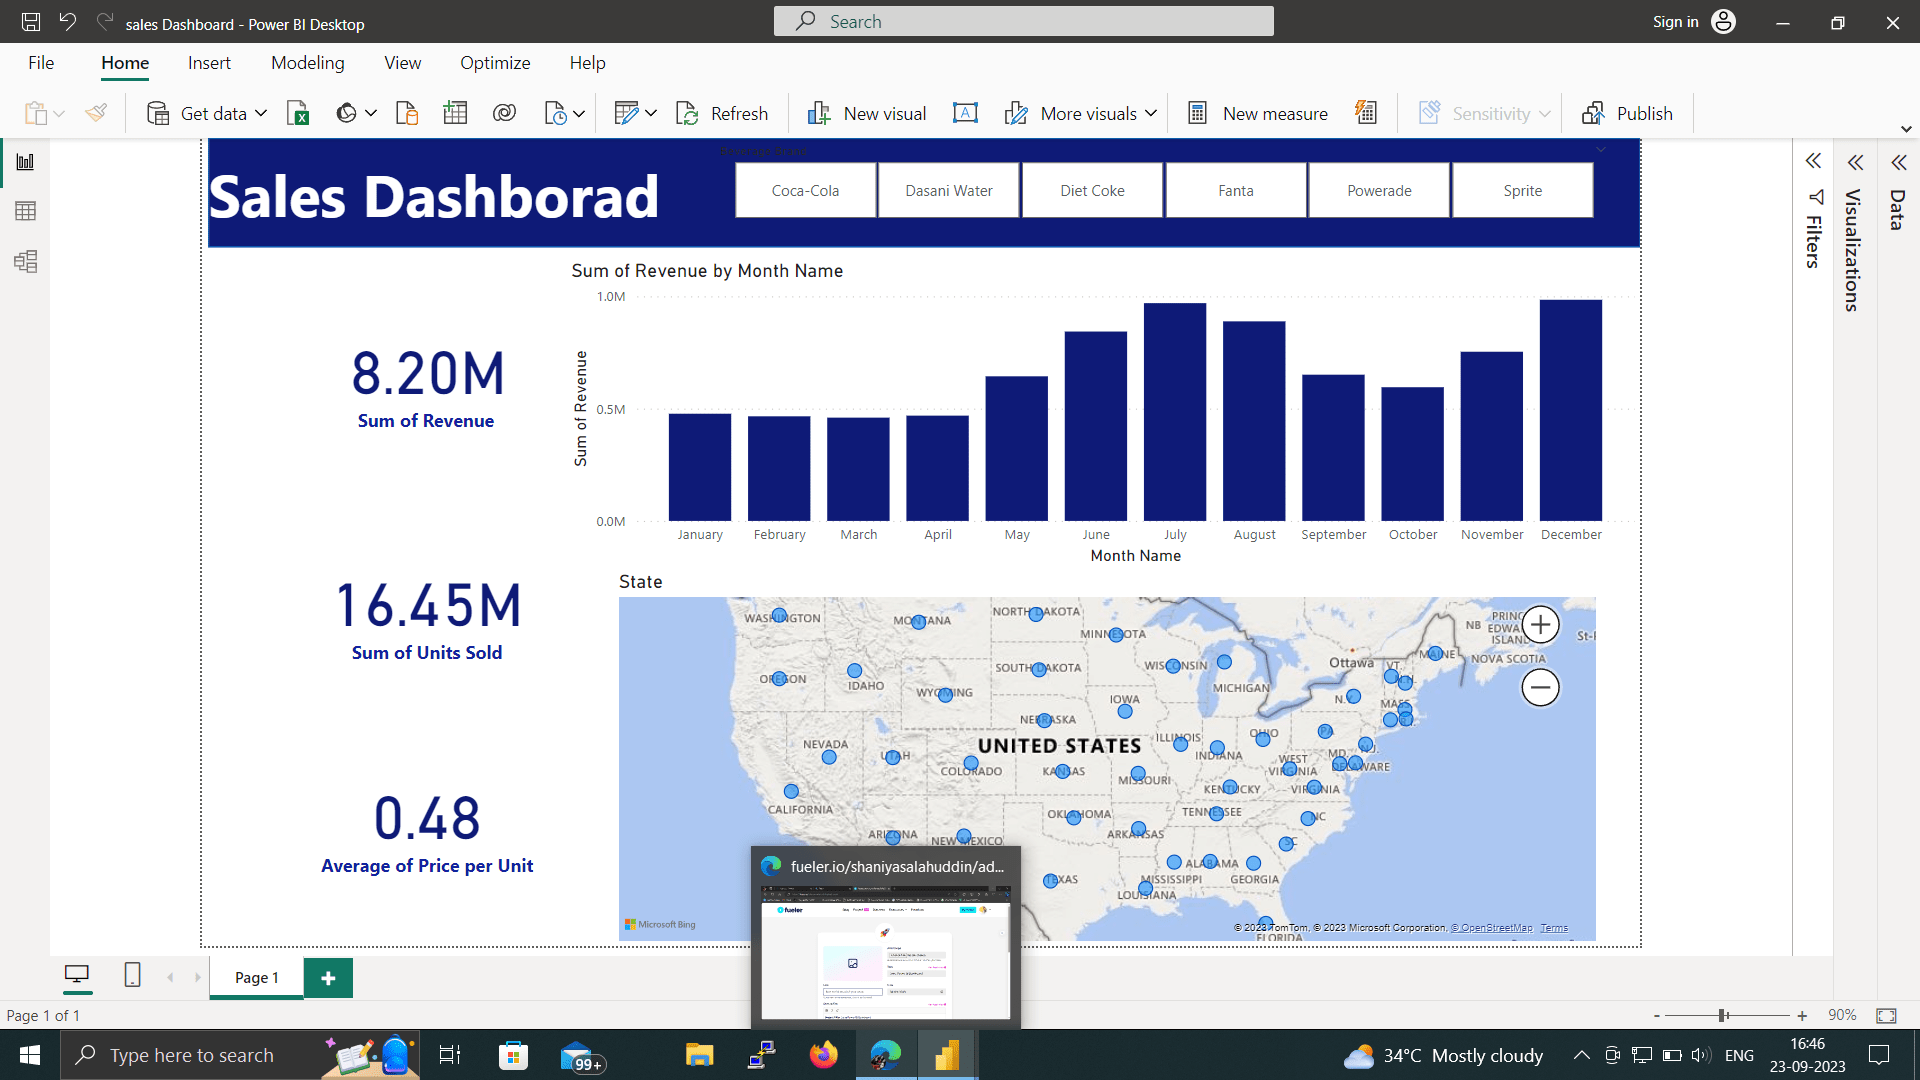
I created a Power BI dashboard to help my Client understand their sales performance and progress in sales. The dashboard includes the following KPIs:
- Revenue
- The sum of unit sales
- Average price per unit
- The sum of revenue by month
- The sum of revenue by state
The dashboard also includes visualizations to show sales data by region, beverage brand, and product.
Benefits:
The Power BI dashboard provides my client with the following benefits:
- A clear and concise overview of their sales performance
- The ability to identify trends and patterns in their sales data
- The ability to drill down into specific data points to get more detailed information
- The ability to share the dashboard with other stakeholders to collaborate on sales strategies
Results:
My client is now able to use the Power BI dashboard to make more informed decisions about their sales business. For example, they can use the dashboard to identify which regions and products are performing well and which ones need improvement. They can also use the dashboard to track their progress toward their sales goals.
Conclusion:
The Power BI dashboard is a valuable tool that can help businesses to improve their sales performance. I am proud of the work that I did on this project and I am confident that it will help my client to achieve their sales goals.
22 Sep 2023