
Road Accident Data Visualization
Road Accident Dashboard
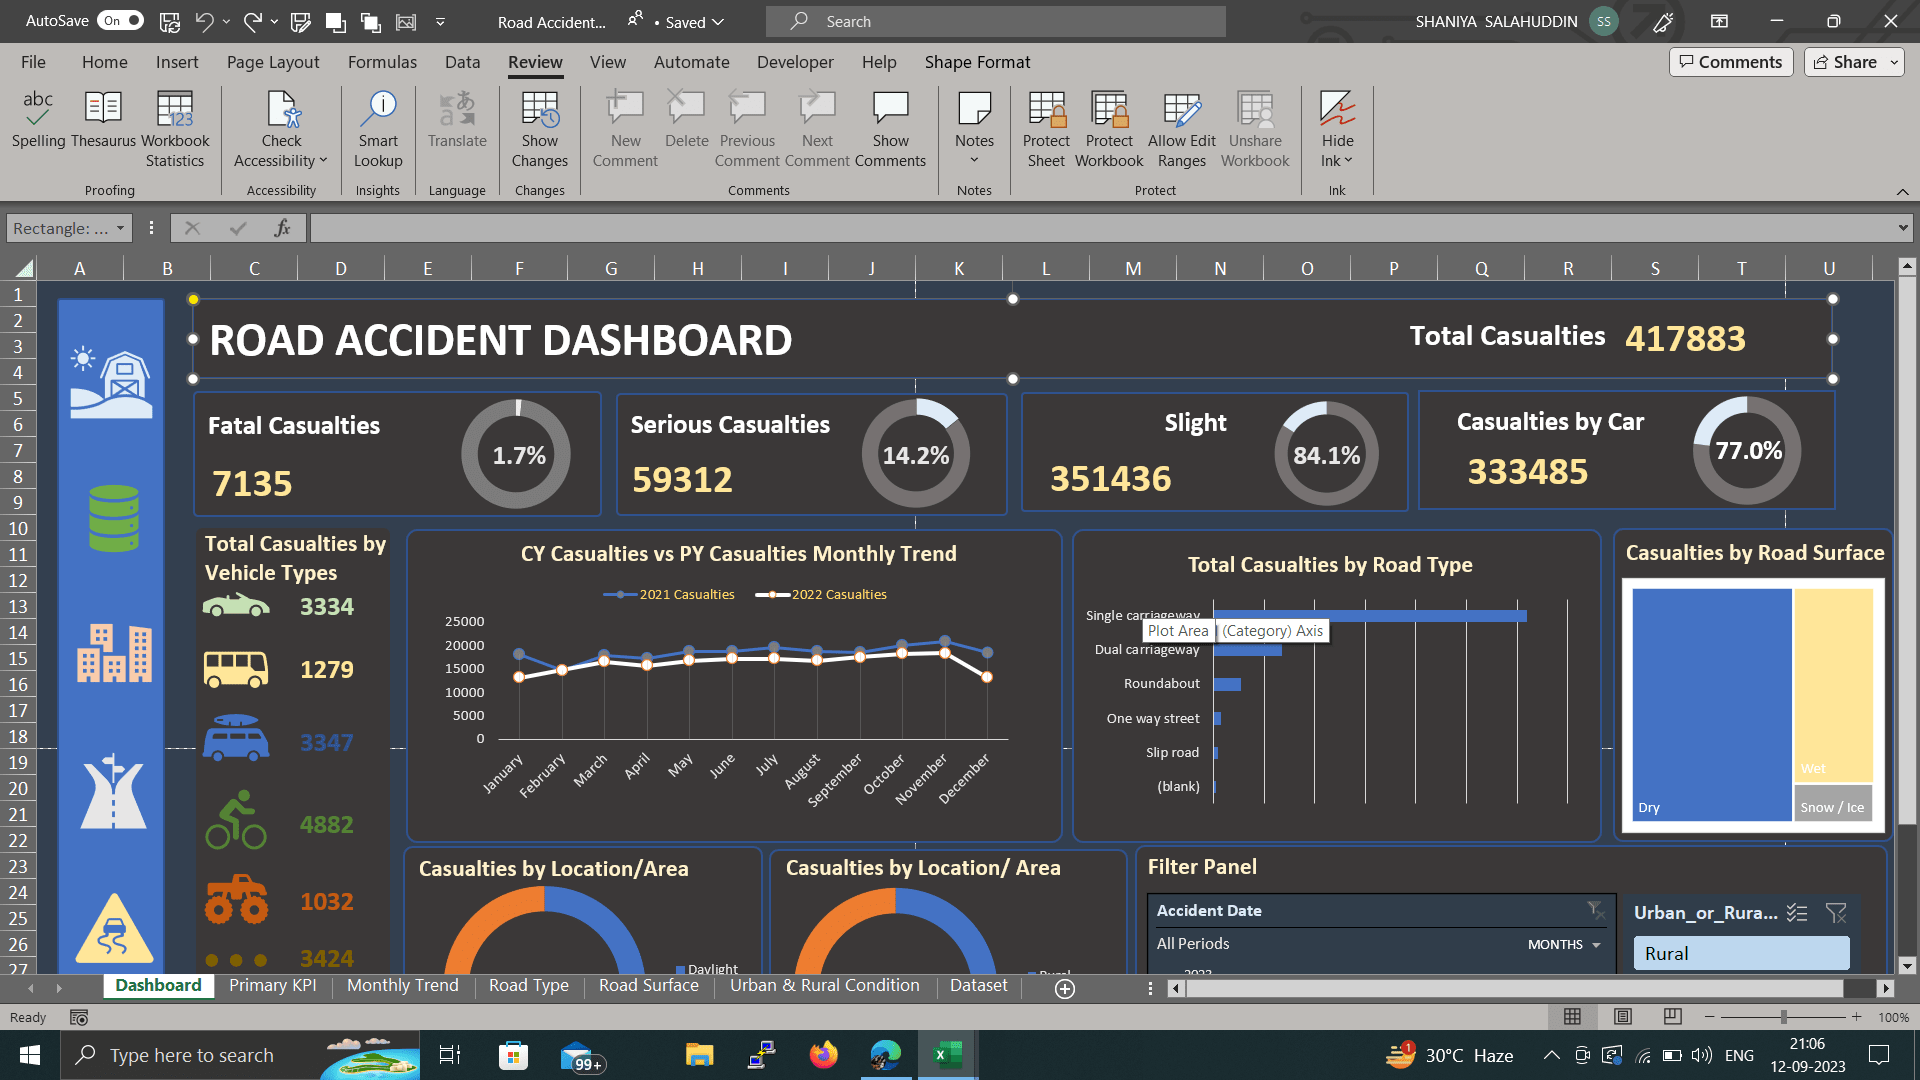
This dashboard provides an overview of road accidents in India. It was created using data from the Ministry of Road Transport and Highways (MoRTH). The dashboard has two key performance indicators (KPIs):
- Primary KPI: Total casualties, fatal casualties, serious casualties, slight casualties, and accidents by cars.
- Secondary KPIs: Total casualties by vehicle types, current year casualties v/s previous year casualties monthly trend, total casualties by road type, casualties by location, casualties by road surface, and casualties by time like daytime or night.
The dashboard can be used to track the trends of road accidents in India, identify the most common causes of accidents, and target interventions to reduce the number of accidents and casualties.
This dashboard is a valuable tool for policymakers, researchers, and other stakeholders who are working to improve road safety in India. It is also a good example of how data can be used to create informative and impactful visualizations.
08 Aug 2023
Keywords
Data Visaulization
Microsoft Office
Dashboard