Data Profession Survey Dashboard - PowerBI
Objective
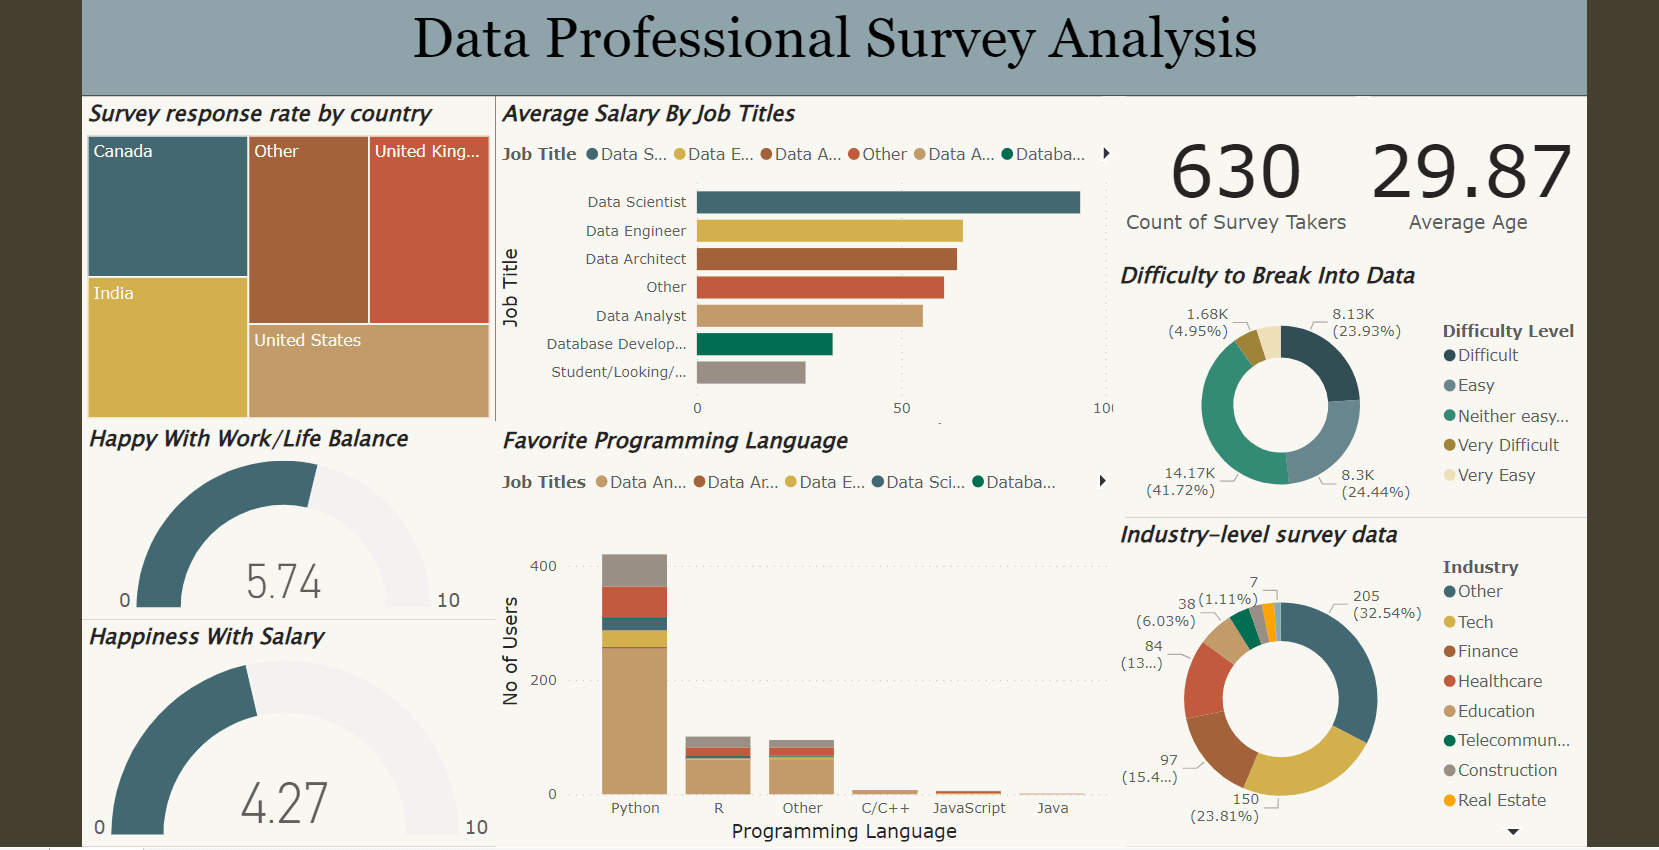
The objective of this project is to analyze a survey conducted among data professionals and gain valuable insights into the industry. The project aims to provide a comprehensive analysis of the survey data using interactive visualizations and dashboards created with Power BI. The goal is to uncover trends, patterns, and key findings that can help professionals and organizations make informed decisions and drive improvements in the data field.
Development Time
This project took approximately 4 hours to build. The development time can vary based on the size of the survey data, complexity of analysis, and customization of the Power BI dashboard.
Pricing
The pricing for creating a similar data analysis project using Power BI depends on factors such as the volume of survey data, specific requirements, and desired level of complexity in the dashboard. For detailed pricing information and project consultations, please contact us at mohammedkayser143@gmail.com
Tools Used
The Data Profession Survey Analysis project was developed using the following tools and technologies:
- Power BI: A powerful business intelligence tool used for data visualization, reporting, and interactive dashboards.
- Microsoft Excel: Used for data preprocessing, cleaning, and transformation before importing into Power BI.
Project Ownership
This project was developed by Mohammed Kayser. It was completed as an individual project . For further information or collaboration opportunities, please feel free to reach out to us
03 Jun 2023