Customer Segmentation - K - Means
This project focuses on customer segmentation using K-Means clustering, a popular machine learning algorithm. The data used for this analysis comes from a dataset of mall customers, including features like Age, Gender, Annual Income, and Spending Score. The goal is to identify distinct groups within the customer base to tailor marketing strategies effectively.
Table of Contents
- Data Exploration
- Data Visualization
- K-Means Clustering
- Segmentation with Age and Spending Score
- Segmentation with Annual Income and Spending Score
- Segmentation with Age, Annual Income, and Spending Score
- Conclusion
Data Exploration
The dataset consists of 200 entries with the following columns: CustomerID, Gender, Age, Annual Income (k$), and Spending Score (1-100). The initial exploration includes checking for null values, duplicate entries, and basic statistical summaries of the data.
Data Visualization
Several plots were created to understand the distribution and relationships between the features:
- Distribution Plots: Show the distribution of Age, Annual Income, and Spending Score.
- Violin and Swarm Plots: Illustrate the distribution of Age, Annual Income, and Spending Score by Gender.
- Correlation Heatmap: Displays the correlation between Age, Annual Income, and Spending Score.
- Bubble Plot: A scatter plot with bubbles representing Spending Score, colored by a custom palette.
K-Means Clustering
Segmentation with Age and Spending Score
The first segmentation is based on Age and Spending Score. The Elbow Method is used to determine the optimal number of clusters.
Segmentation with Annual Income and Spending Score
The second segmentation uses Annual Income and Spending Score. The Elbow Method is again applied to determine the optimal number of clusters.
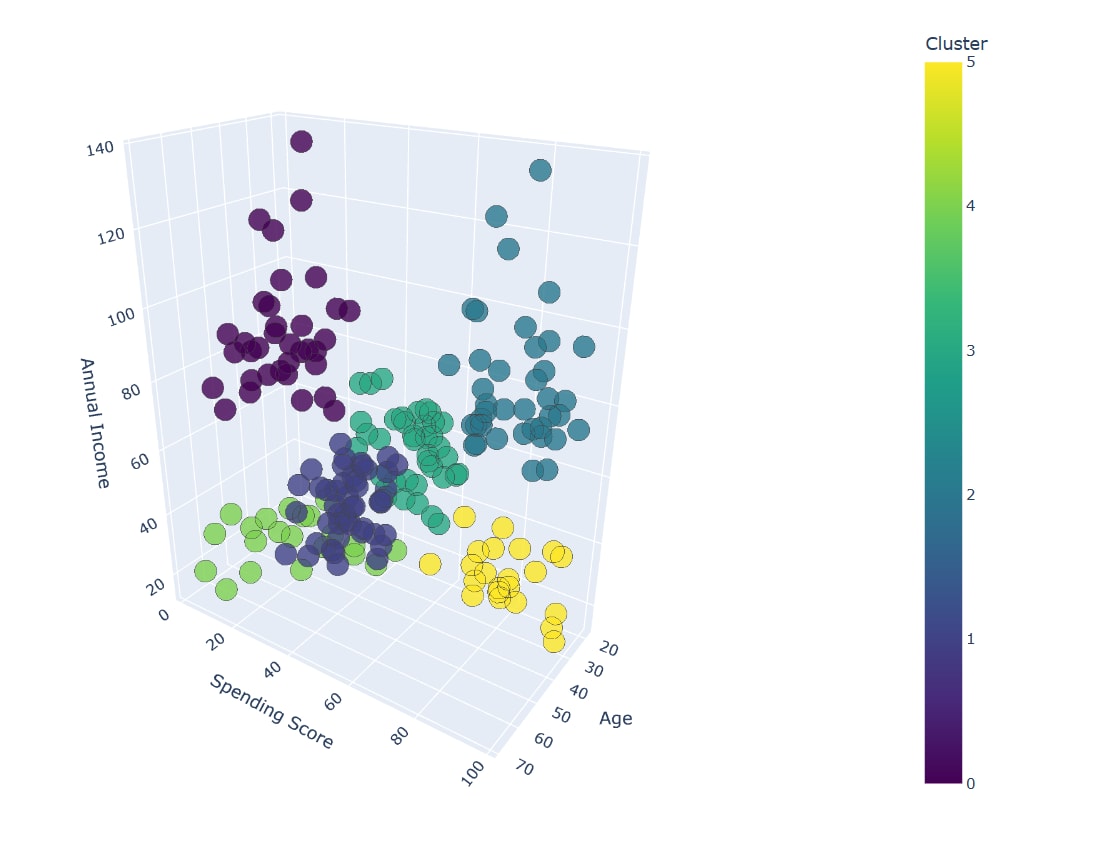
Segmentation with Age, Annual Income, and Spending Score
The final segmentation uses all three features: Age, Annual Income, and Spending Score. A 3D scatter plot is created to visualize the clusters.
Conclusion
This project successfully demonstrated the use of K-Means clustering for customer segmentation. By analyzing Age, Annual Income, and Spending Score, distinct customer groups were identified. These insights can be used to develop targeted marketing strategies and improve customer satisfaction.
27 May 2024