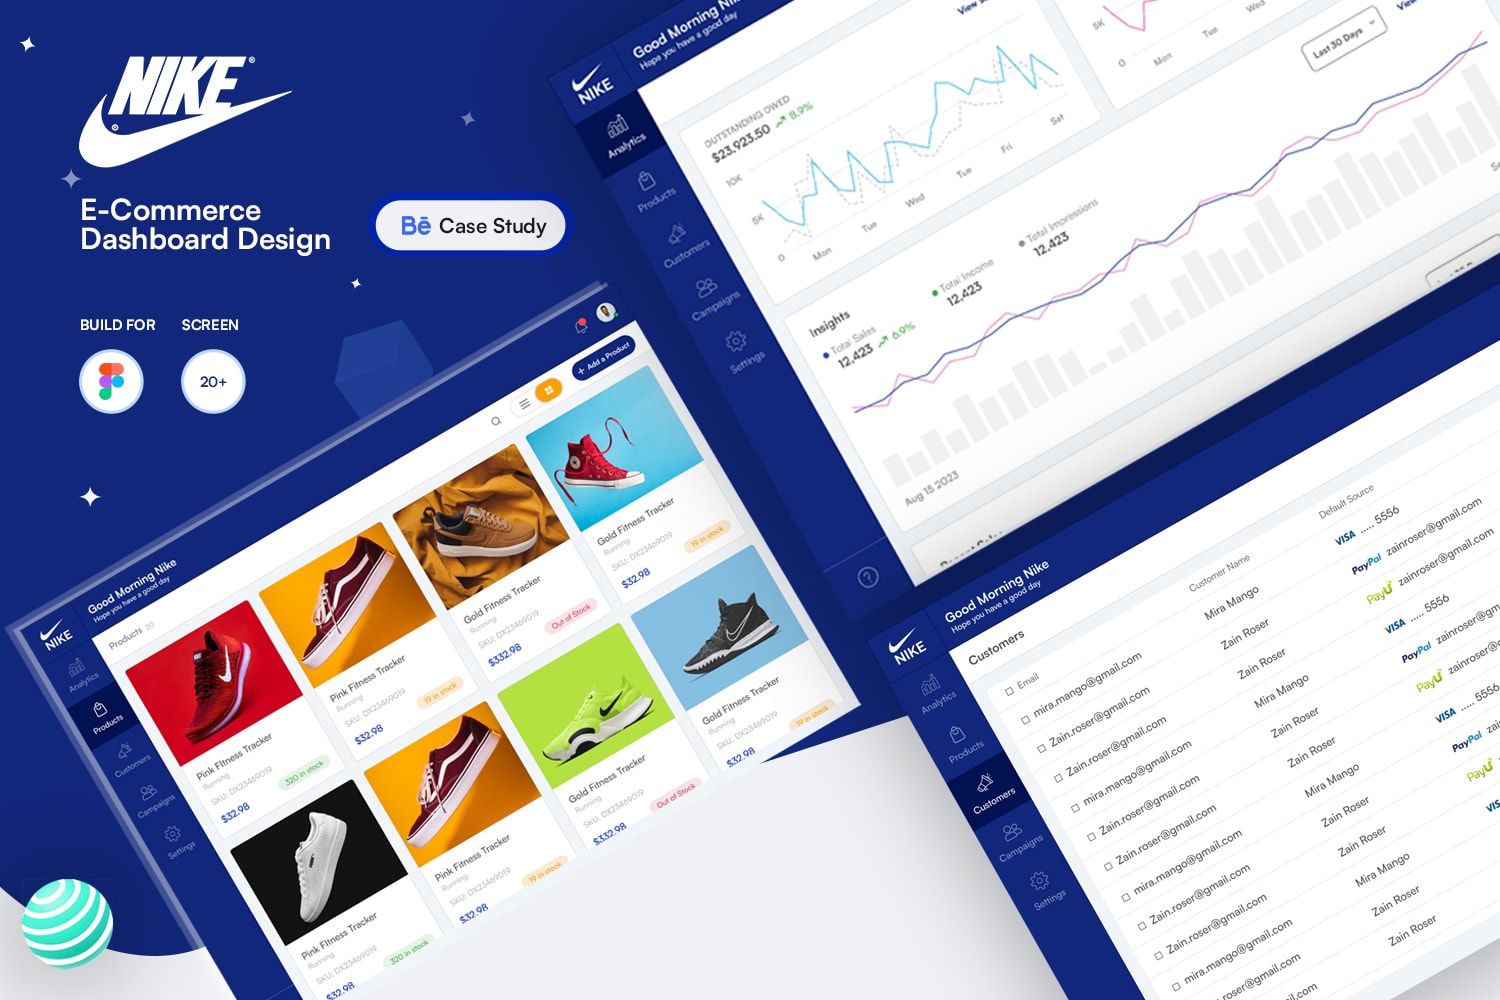
Nike Footwear Dashboard Design
Creating a dashboard design for Nike footwear would involve several key elements to provide a comprehensive overview of various aspects related to their footwear products. Here's a breakdown of what such a dashboard might include:
1. Product Overview:
- This section provides a snapshot of key metrics related to Nike footwear, such as total sales, revenue, units sold, and average selling price.
- Visual representations like charts or graphs can quickly convey this information.
2. Sales Performance:
- A detailed breakdown of sales performance over time, segmented by regions, countries, or even specific stores if applicable.
- Comparative analysis between different product lines or categories to identify top-performing products and areas for improvement.
3. Inventory Management:
- Insights into current inventory levels, including stock availability, turnover rates, and inventory aging.
- Alerts for low stock or excess inventory to facilitate better supply chain management.
4. Customer Engagement:
- Metrics related to customer engagement and satisfaction, such as customer feedback ratings, reviews, and social media mentions.
- Analysis of customer demographics and preferences to inform future product development and marketing strategies.
5. Trend Analysis:
- Tracking of fashion trends, consumer preferences, and market demand to anticipate future trends and adjust production accordingly.
- Integration of external data sources like fashion blogs, social media influencers, and industry reports to stay ahead of the curve.
6. Quality Control:
- Monitoring of product quality metrics, including defect rates, return rates, and customer complaints.
- Collaboration with manufacturing partners to address quality issues and ensure consistent product quality.
7. Competitor Analysis:
- Benchmarking Nike's performance against key competitors in the footwear industry.
- Comparison of product features, pricing strategies, and marketing initiatives to identify competitive advantages and areas for differentiation.
8. Supply Chain Visibility:
- Tracking of the entire supply chain process, from raw material sourcing to manufacturing to distribution.
- Real-time updates on production status, shipping delays, and inventory movement to optimize efficiency and minimize disruptions.
9. Customization and Personalization:
- Tools for customers to customize their footwear orders, such as selecting colors, materials, and personalized branding options.
- Data analytics to analyze the popularity of customization options and tailor offerings to meet customer preferences.
10. Sustainability Metrics:
- Measurement of Nike's sustainability efforts, such as carbon footprint reduction, use of eco-friendly materials, and waste management initiatives.
- Transparency in communicating sustainability goals and progress to stakeholders, including customers, investors, and regulatory agencies.
Overall, the Nike footwear dashboard design should prioritize usability, providing actionable insights to support decision-making across various departments, from product development to marketing to supply chain management. Visualizations should be clear and intuitive, enabling users to quickly grasp key trends and performance indicators. Additionally, the dashboard should be adaptable to evolving business needs and incorporate feedback from users to continuously improve its effectiveness.
19 Apr 2024