AYUSH E-Commerce Sales Dashboard in Power BI
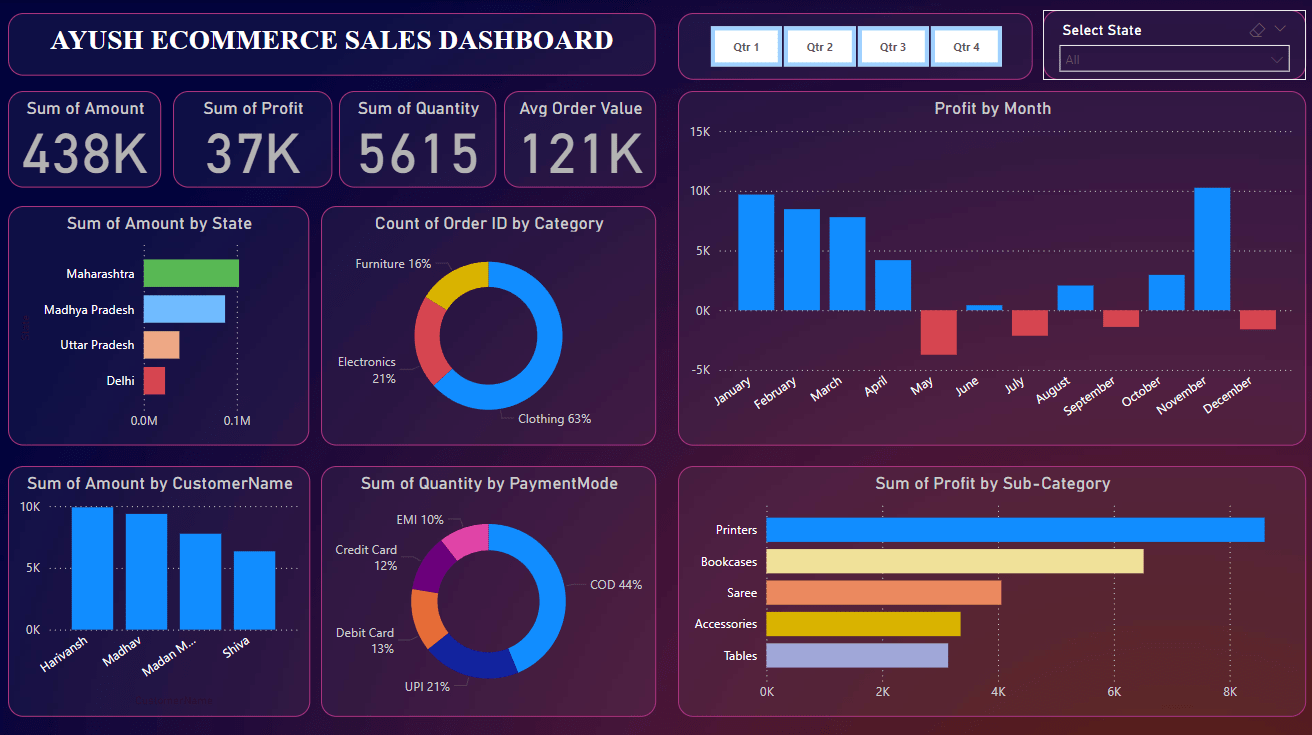
As part of my recent project, I developed a highly responsive AYUSH E-Commerce Sales Dashboard using Power BI, designed to provide in-depth insights into product sales performance. This dashboard integrates multiple datasets, including detailed Order Information, Product Categories, Subcategories, and other essential metrics.
I utilized advanced Power BI visualizations such as stacked graphs, slicers, filters, and dropdowns to make data interaction intuitive and insightful. These visual elements enable users to easily filter data, compare product performance across different segments, and analyze trends over time.
The dashboard is optimized for various devices, ensuring seamless access and analysis for decision-makers. By leveraging Power BI’s powerful data modeling and reporting features, the dashboard offers real-time sales insights and helps in identifying key trends to improve decision-making.
This project was a great opportunity to apply my skills in data visualization, business analytics, and Power BI, ultimately driving actionable insights for the e-commerce sales.
12 Aug 2024


