Real Estate Data Visualization
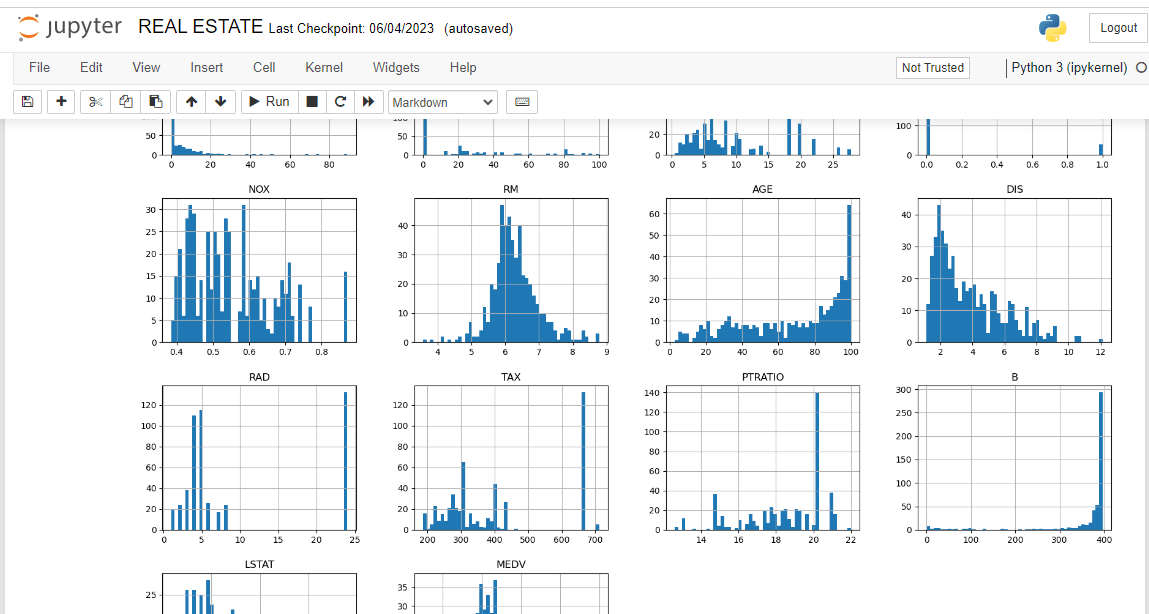
In this real estate data visualization project, Python and visualization libraries are harnessed to provide insightful predictions and enhance decision-making processes within the real estate sector. Leveraging Python's robust ecosystem, including libraries like Pandas, Matplotlib, and Seaborn, this project employs advanced statistical modeling and visualization techniques to forecast key trends and patterns in the real estate market.
By analyzing historical sales data, market trends, and various socio-economic factors, predictive models are developed to forecast future property prices, demand, and market dynamics. These predictions empower stakeholders, including investors, developers, and real estate agents, to make informed decisions regarding property investments, pricing strategies, and market positioning.
Through interactive and visually engaging dashboards and charts, stakeholders gain a comprehensive understanding of the real estate landscape, enabling them to identify lucrative opportunities, mitigate risks, and optimize their investment portfolios. This project exemplifies the power of data visualization and predictive analytics in revolutionizing the real estate industry, driving strategic growth and maximizing returns on investment.
11 Feb 2024


