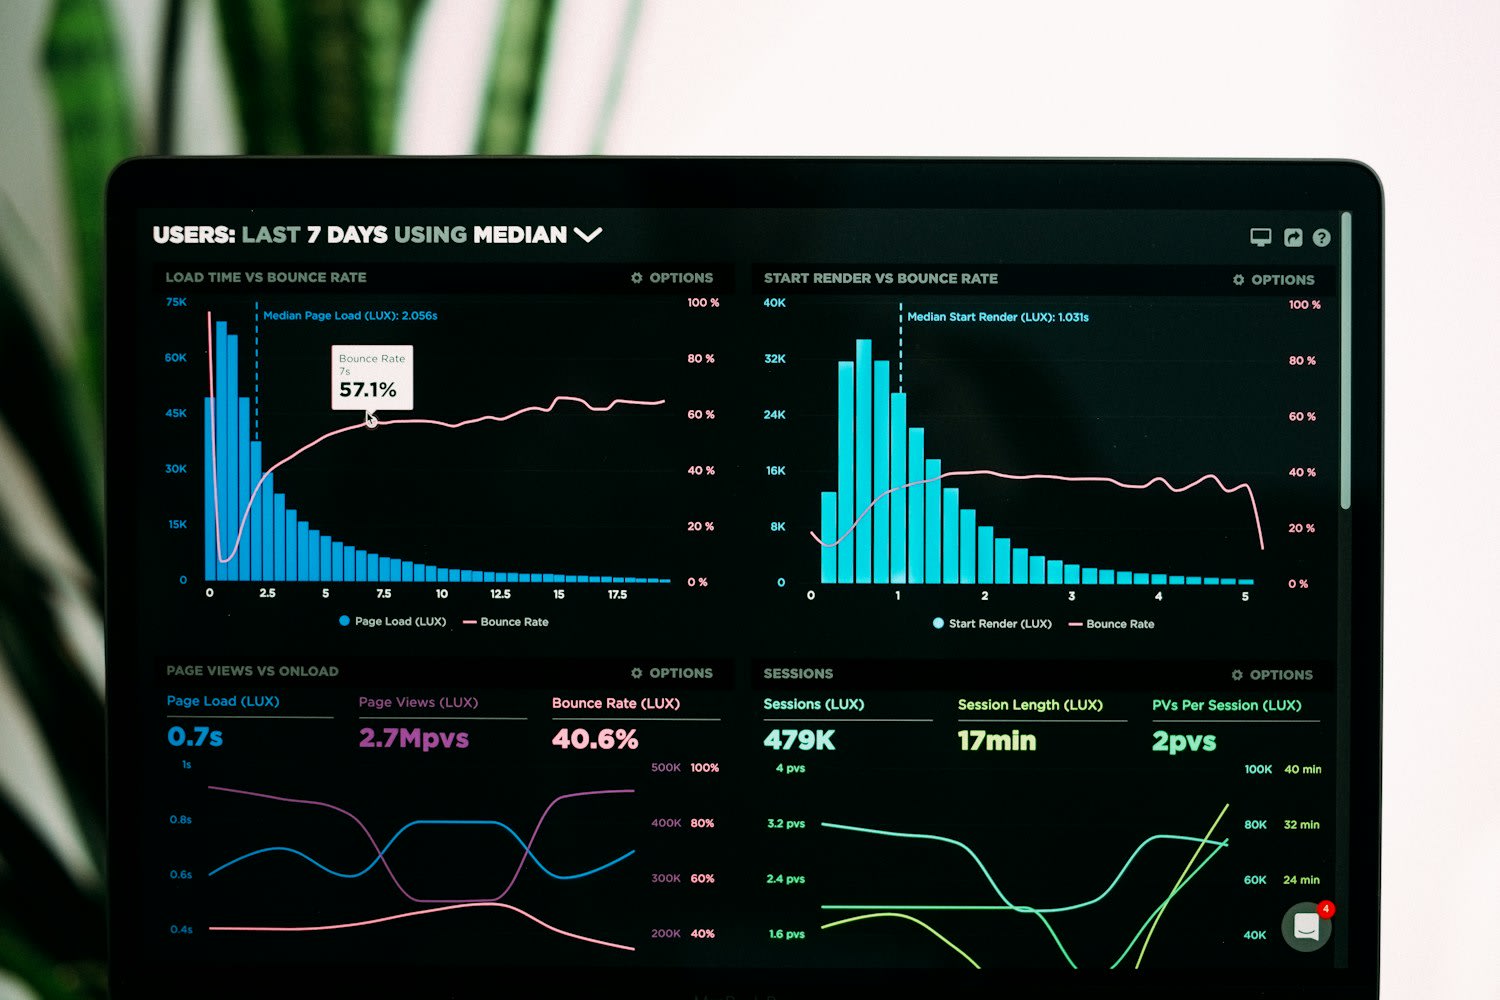
Analytics Dashboard: Product Performance Optimization
Led development of comprehensive analytics dashboard to empower data-driven decision-making across product teams. Role: Designed UX for real-time metric visualization, implemented custom filters for 15+ KPIs (user engagement, retention, conversion). Outcome: 40% reduction in metric identification time, 25% improvement in stakeholder reporting efficiency. Utilized Tableau, SQL, Python for backend data processing. Independently owned end-to-end project from discovery to production deployment.
04 Nov 2025