real-time-stock-visualizer
Real-Time Stock Data Visualizer
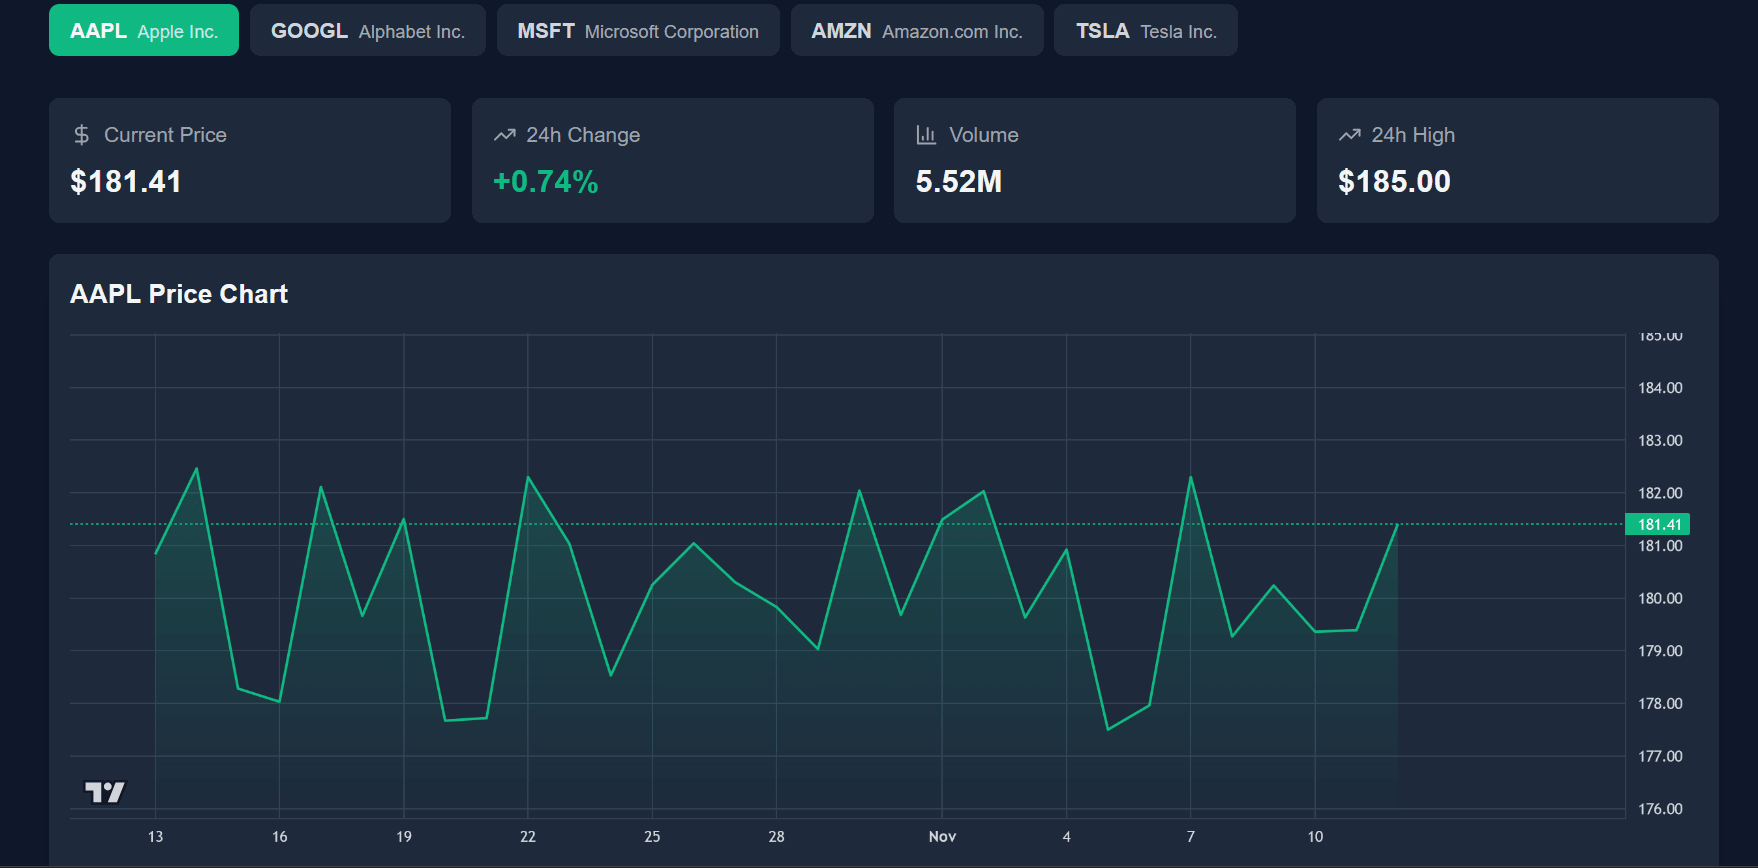
A real-time stock data visualization application built with React, WebSockets, and the TradingView Charting Library. This application streams live stock market data and visualizes it with custom animations, providing a seamless and interactive experience for users tracking stock trends.
Features
- Real-Time Data Streaming: Uses WebSockets to receive and display live stock data with minimal latency.
- TradingView Chart Integration: Displays interactive and customizable stock charts (e.g., candlestick, line) with options for time intervals, overlays, and indicators.
- Cool Animations: Enhances the user experience with animations for data updates, loading states, chart interactions, and UI transitions.
- Responsive Design: Optimized for both desktop and mobile viewing.
Demo
Thanks a ton!
10 Aug 2024
Keywords
Coding
Tech
Tools
Stock
Design
TradingView
WebSocket
React
Next.js
Typescript