Top 7 AI Business Intelligence Tools for Startups

Riten Debnath
29 Mar, 2026
Last updated: March 2026
In the startup world, data is often the difference between a successful pivot and a quiet exit. Most founders I talk to are drowning in metrics DAU, CAC, LTV, churnbut they are starving for actual meaning. If you are still relying on a "data guy" to manually pull SQL queries every time you have a question, you are moving at a snail's pace in a Formula 1 race. 2026 has officially killed the static dashboard. Today’s top startups are using "Active Intelligence" tools that don't just show you a chart but actually alert you when a trend breaks or a goal is at risk. This isn't about having more data; it's about having the right answer at the exact moment you need to make a move.
I’m Riten, founder of Fueler, a skills-first portfolio platform that connects talented individuals with companies through assignments, portfolios, and projects, not just resumes/CVs. Think Dribbble/Behance for work samples + AngelList for hiring infrastructure.
At a glance: Comparing the Top AI Business Intelligence Tools for Startups
1. Tableau Pulse (by Salesforce)
Best for: Startups that need a "metrics-first" mobile experience and proactive goal tracking.
Tableau Pulse is a massive departure from the heavy, complex Tableau of the past. It is built specifically for busy people who don't have time to build dashboards. Instead of a canvas, it gives you a "Pulse" feed a personalized stream of the metrics that matter most to your role. It uses AI to identify why a number is changing and presents that insight in plain language. For a startup founder, it’s like having a news feed for your business KPIs. It focuses heavily on "pacing," telling you if you’re on track to hit your end-of-month targets before it’s too late to change course.
Key Features
- Personalized Metric Digest: The agent creates a customized daily briefing sent via Slack or Email, summarizing only the changes in the KPIs you have specifically "favorited."
- Natural Language "Why" Insights: When a metric like "User Growth" spikes, Pulse automatically generates a text summary explaining the root cause, such as a specific marketing campaign or a regional trend.
- Pace-to-Goal Tracking: It uses historical data to predict if you will hit your goals by the end of the period, labeling metrics as "On Track" or "Off Track" in real-time.
- Mobile-First Exploration: The interface is designed for the phone, allowing you to "Analyze with AI" and ask follow-up questions about your data while you are between meetings.
- Direct Integration with Salesforce: It pulls data seamlessly from the Salesforce ecosystem, making it a powerhouse for sales-led startups that need instant visibility into their pipeline.
Pricing
Tableau Pulse is generally available as part of the Tableau Cloud subscriptions. The "Creator" license is $75 per user per month, while "Viewer" licenses for those who just need to see the Pulse feed are roughly $15 per user per month.
Why it matters
Tableau Pulse matters because it stops "dashboard fatigue." Most startup employees stop checking dashboards after a week. By pushing the data to where people already work (Slack/Email) and focusing only on goals, it ensures that your team stays focused on the numbers that actually drive the business forward.
2. Microsoft Fabric (with Copilot)
Best for: Startups already deep in the Microsoft ecosystem looking for a "single source of truth."
Microsoft Fabric is essentially an "everything-in-one" data platform that combines data warehousing, engineering, and BI into a single experience. It introduced a new way of thinking about data called "OneLake", one copy of your data that every tool in the company can see. For startups, this is a lifesaver because it eliminates the need to pay for five different tools to move, store, and visualize data. With the built-in Copilot, you can literally describe the report you want to see, and Fabric will build the data pipeline and the Power BI dashboard for you from scratch.
Key Features
- OneLake Architecture: It creates a single "OneDrive for Data," meaning you never have to duplicate or move data between different departments or tools again.
- Copilot for Data Engineering: You can use chat to write complex SQL queries or Python code, allowing a small team to manage an enterprise-grade data warehouse.
- Real-Time Analytics: It can ingest and analyze data as it happens, which is critical for startups in fintech or e-commerce, where every second of downtime or fraud counts.
- Direct Lake Mode: This allows Power BI to report on massive datasets without needing to "refresh" or import them, providing sub-second speed on billions of rows.
- Unified Governance: It provides a single place to manage security and permissions across your entire data stack, ensuring you stay compliant as you scale.
Pricing
Fabric uses a "Capacity" model rather than just per-user fees. The smallest tier (F2) starts at approximately $262 per month (pay-as-you-go). For smaller teams, you will also need Power BI Pro licenses at $10 per user per month for report creators.
Why it matters
Fabric matters because it solves the "fragmented data" problem that kills startups. Instead of spending your limited engineering hours stitching together different databases and BI tools, you get a pre-integrated factory that grows with you from your first user to your IPO.
3. Sigma Computing
Best for: Teams that love Excel but need the power and security of a cloud data warehouse.
Sigma is the tool that finally realized that everyone actually just wants to use a spreadsheet. It looks and feels exactly like Excel or Google Sheets, but it is actually a live interface for your cloud warehouse (like Snowflake or BigQuery). When you "pivot" a table in Sigma, it is actually writing high-performance SQL in the background. This is a game-changer for startups because it allows non-technical team members in Finance or Operations to explore "live" production data without the risk of breaking anything or needing to learn how to code.
Key Features
- Spreadsheet-to-SQL Interface: Use familiar formulas (like SUMIF or VLOOKUP) on billions of rows of live data without ever leaving the spreadsheet UI.
- Live Warehouse Querying: There is no "data extraction" involved; Sigma queries your warehouse in real-time, so your numbers are never out of sync.
- Input Tables: This unique feature allows users to "write back" to the warehouse, making it possible to do scenario planning or add manual annotations directly into your data.
- Template-Based Dashboards: You can turn any spreadsheet analysis into a professional dashboard with a single click, making it easy to share insights with investors.
- Collaborative Workbooks: Multiple people can work on the same data analysis at the same time, just like in Google Docs, but with the power of a multi-million dollar data stack.
Pricing
Sigma typically starts at $300 per month as a platform fee, with additional costs based on the number of "Creators" and "Explorers" you have. They offer custom "Startup" pricing for early-stage companies, which is often heavily discounted.
Why it matters
Sigma matters because it empowers the "Excel experts" already on your team. You don't need to hire a specialized BI developer to get insights; your existing finance or ops person can become a data powerhouse on day one using the skills they already have.
4. Metabase (with Metabot AI)
Best for: Budget-conscious startups that want an easy-to-use, open-source-friendly BI tool.
Metabase has long been the favorite of the startup world because of its simplicity and "ask a question" interface. In 2026, it doubled down on this with Metabot AI, which helps users generate SQL and debug queries through a simple chat interface. Metabase is designed to be set up in five minutes. It’s perfect for the "self-serve" era, where you want your product managers and marketers to be able to find their own answers without opening a Jira ticket for the data team. It’s clean, fast, and stays out of your way.
Key Features
- Visual Query Builder: Non-technical users can build complex joins and filters using a "click-and-drag" interface that feels more like a game than a database tool.
- Metabot AI Assistant: A chat-based helper that can write SQL for you, explain what a specific table means, or suggest the best way to visualize a result.
- X-Ray Reports: Click one button on any table and Metabase will automatically generate a full dashboard of insights, charts, and trends for that data.
- Interactive Embedding: You can easily embed your Metabase charts directly into your own product, allowing your customers to see their own data and analytics.
- Open Source Core: For startups that want to keep things "in-house," you can self-host the basic version for free, maintaining total control over your data privacy.
Pricing
The Starter Cloud plan is $85 per month (includes 5 users). For more advanced features like row-level security and white-labeling, the Pro plan starts at $500 per month plus $10 per user.
Why it matters
Metabase matters because it lowers the barrier to entry. It is the most "human" BI tool on the market. If you want a culture where everyone, not just the engineers, is looking at data every day, Metabase is the fastest way to get there.
5. Mode (by ThoughtSpot)
Best for: Data-heavy startups where analysts need to switch between SQL and Python/R seamlessly.
Mode is the ultimate workspace for the "Modern Data Analyst." It is unique because it combines a high-powered SQL editor with built-in Python and R notebooks. This means you can pull your data with SQL and then immediately jump into a Python cell to do a complex forecast or a machine learning model, all in the same window. Since being acquired by ThoughtSpot, it has also gained "search-driven" analytics, meaning that after the analyst builds the model, a business user can simply "search" through the results to find what they need.
Key Features
- Integrated Python/R Notebooks: Perform advanced data science-like clustering or predictive modeling, directly on top of your SQL query results without switching tools.
- Helix Data Engine: A high-speed memory layer that allows users to interact with and filter millions of rows of data instantly without re-running SQL queries.
- Visual Explorer: A drag-and-drop interface for business users that allows them to take the "official" datasets built by analysts and create their own custom views.
- HTML/CSS Custom Dashboards: You can build completely custom, branded data apps using web code, making your reports look like a bespoke part of your company's brand.
- dbt Integration: It syncs perfectly with dbt (data build tool), ensuring that your BI layer is always using the most up-to-date and "cleaned" versions of your data.
Pricing
Mode offers a "Studio" version for free for up to 3 users (with limits). The "Pro" version is customized for startups but typically starts around $500 to $1,000 per month, depending on the number of users and data volume.
Why it matters
Mode matters because it bridges the gap between the "Data Scientist" and the "Business User." It allows your most technical people to do deep work while ensuring that work remains accessible and useful to the rest of the company.
6. Looker (Google Cloud)
Best for: Scaling startups that need strict "Data Governance" and a centralized semantic layer.
Looker is not just a visualization tool; it is a "Data Platform." Its secret weapon is LookML, a modeling language that allows you to define your business logic (like "What is a 'customer'?") once and reuse it everywhere. This prevents the nightmare where the Sales team and the Marketing team show two different numbers for the same metric. In 2026, Looker integrated Duet AI, allowing users to generate these complex models and ask questions of their data using natural language, all while sitting on top of Google’s BigQuery.
Key Features
- LookML Semantic Layer: Centralize all your business logic so every department is looking at the same "single version of the truth."
- Duet AI Integration: Use AI to generate LookML code, write SQL queries, and summarize dashboard insights for faster decision-making.
- Looker Studio Pro: A more user-friendly version of Looker that allows for "drag-and-drop" report building while still using the governed data from the main Looker platform.
- Action Hub: Don't just look at data. You can set up "Actions" that automatically trigger a Slack message, a Zendesk ticket, or a Hubspot update based on data changes.
- Embedded Analytics (Powered by API): Looker is the gold standard for startups that want to build data-heavy features into their own applications for their customers.
Pricing
Looker is an enterprise tool with a higher entry point. The Standard Edition starts at approximately $5,000 per month ($60,000 annually). However, for Google Cloud customers, there are often credits and bundles that can make this more accessible for venture-backed startups.
Why it matters
Looker matters when you start to scale. It is an insurance policy against "data chaos." When you have 100+ people all looking at data, Looker ensures they are all speaking the same language and making decisions based on the same verified numbers.
7. Domino Data Lab
Best for: Startups building their own AI products or those with heavy Machine Learning (MLOps) needs.
Domino is a bit different from the other tools on this list. It isn't just for looking at charts; it is for building the AI models that drive your startup. It is an "Enterprise AI" platform that gives your data scientists the infrastructure they need to research, train, and deploy models at scale. If your startup’s product is an AI agent or a recommendation engine, Domino is the workbench you use to ensure your models are accurate, secure, and cost-effective. It manages everything from your "compute" (the GPUs you need) to the version control of your data.
Key Features
- Self-Service Infrastructure: Data scientists can launch powerful GPU clusters with a single click, allowing them to train models without waiting for an IT or DevOps team.
- Reproducibility Engine: It automatically tracks every version of code, data, and environment, so you can always go back and see exactly how a model reached a specific conclusion.
- Model Monitoring: The agent watches your deployed AI models in production and alerts you if their performance starts to "drift" or become inaccurate over time.
- Integrated FinOps: It provides granular reports on exactly how much your AI experiments are costing, helping startups avoid massive surprise cloud bills.
- Collaborative AI Registry: A central "library" where your team can share, reuse, and audit all the AI models being built across the company.
Pricing
Domino is a high-end platform. They offer a Cloud version for smaller teams, but most startups move to a custom quote. Pricing is based on "Admin" licenses and compute usage, typically starting in the mid-five figures annually.
Why it matters
Domino matters because "Model Drift" is the silent killer of AI startups. If your product relies on AI, you need a professional way to manage those models. Domino provides the "factory floor" that allows you to scale your AI efforts without the whole thing collapsing into a mess of unorganized code.
Which one should you choose?
Your choice depends entirely on the "maturity" of your data stack and your team's technical skills. If you are a small, fast-moving team that needs answers today without a big investment, go with Metabase or Rows. They are easy to set up and very affordable. If you are already using Microsoft 365 and want a platform that handles everything from storage to AI, Microsoft Fabric is the logical choice. For startups that have a lot of "hidden" logic and need to make sure everyone sees the same numbers, Looker is the best long-term play. If your team loves spreadsheets and wants to work with live warehouse data, Sigma will make them feel right at home. Finally, if you are building a heavy AI or ML product, Domino Data Lab is the infrastructure you need to stay organized and secure.
How does this connect to building a strong career or portfolio?
The "Data Analyst" of 2026 is no longer a person who just makes charts; they are a Data Architect who knows how to orchestrate these AI agents. To land a top job at a startup, you need to show that you can move from raw data to a strategic recommendation in hours, not weeks. This is why having a "Proof of Work" portfolio is so vital. You can use a tool like Metabase or Sigma to build a real-world analysis of a public dataset, like analyzing consumer spending trends or e-commerce growth, and then host that project on your Fueler profile. When a founder sees that you’ve built a live, governed data model or a predictive dashboard, they don’t need to see your GPA or your degree. They can see exactly what you are capable of delivering on day one.
The Strategic Advantage of Fueler
At Fueler, we believe that your skills are your real currency. In an age where AI can write a generic resume in five seconds, the only way to prove you are "real" is to show the work you’ve done. We’ve built a platform that allows you to showcase your assignments, your data projects, and your technical skills in a way that is visually engaging and high-intent. When you use these BI tools, you aren't just doing a task; you are creating a "Work Sample." By publishing these samples on Fueler, you are building a professional brand that is backed by evidence. It’s the difference between saying "I know BI" and showing a recruiter the exact dashboard that helped a previous company grow by 20%. Fueler helps you bridge that gap and get hired for what you can actually do.
Final Thoughts
The era of "guessing" in business is over. The AI BI tools of 2026 have made it possible for even the smallest startup to have the same analytical power as a Fortune 500 company. The key is not to get overwhelmed by the options but to pick one tool that aligns with your current workflow. Whether it’s the simplicity of Tableau Pulse or the heavy-duty power of Microsoft Fabric, these tools are designed to give you back your time so you can focus on the big picture. As the data landscape continues to evolve, the winners will be those who can leverage these agents to make faster, smarter, and more daring decisions.
FAQs
1. What is a "Semantic Layer" and why do startups need it?
A semantic layer, like the one in Looker or Sigma, is a middle layer that translates technical database names into business terms (like "Annual Revenue"). It ensures that everyone in the company is using the same definition for their metrics, preventing data silos.
2. Can I use these tools if my data is messy?
Tools like Microsoft Fabric and Tableau have built-in "AI Data Interpreters" that can help clean and structure messy Excel files or databases. However, for the best results, it is always better to have a basic "Data Cleaning" process in place.
3. Is it better to buy a BI tool or build my own dashboards?
In 2026, it is almost always better to buy. The "maintenance cost" of building and securing your own internal data platform is massive compared to the monthly subscription of a tool like Metabase or Mode.
4. Do these tools work with real-time data?
Yes, most modern agents like Veezoo, Fabric, and Sigma connect directly to your data warehouse and can provide insights with only a few seconds of "latency," making them truly real-time.
5. How long does it take to set up an AI BI tool?
For a simple tool like Metabase or Tableau Pulse, you can have your first dashboard running in less than an hour. For enterprise tools like Looker, it can take several weeks to properly model your data and train your team.
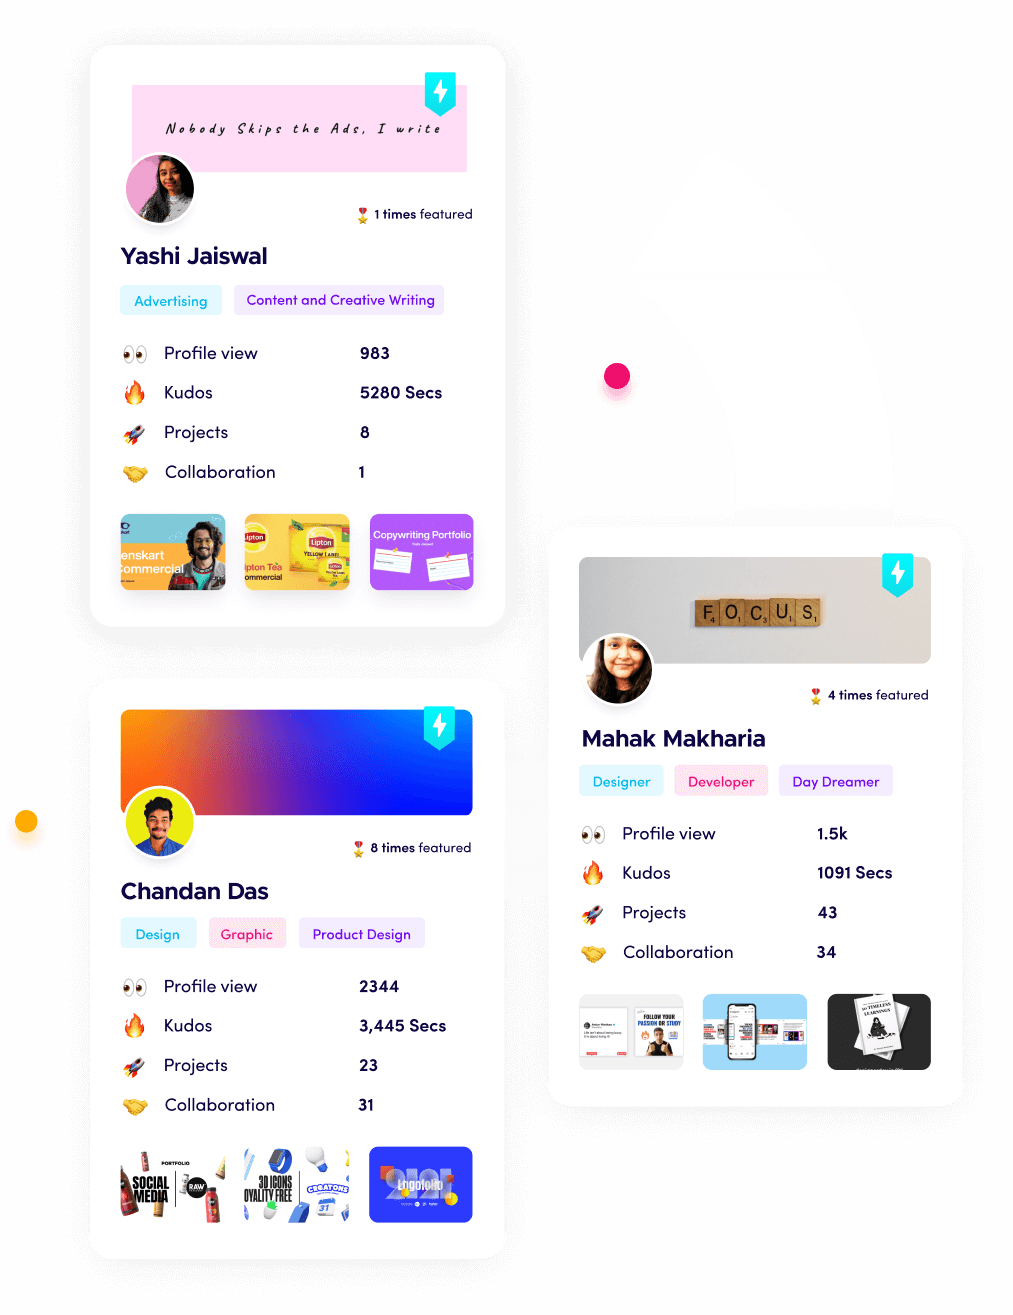
What is Fueler Portfolio?
Fueler is a career portfolio platform that helps companies find the best talent for their organization based on their proof of work. You can create your portfolio on Fueler. Thousands of freelancers around the world use Fueler to create their professional-looking portfolios and become financially independent. Discover inspiration for your portfolio
Sign up for free on Fueler or get in touch to learn more.

What should you do next?
You've read the article. Now turn your skills into proof of work and unlock more opportunities.
Build your proof of work portfolio
Create a clean portfolio with projects, assignments, resumes, and AI stack details that companies actually want to see.
Create your Fueler portfolio →Apply through assignments, not resumes
Stand out by solving real tasks from companies hiring on Fueler.
Explore assignments →Get discovered by companies
Make your work public and let recruiters discover your skills through actual projects instead of keywords.
Get discovered →