How to Create Infographics for US Audiences

Riten Debnath
11 Jul, 2025
Want to grab attention and make your data easy to understand? Infographics are a powerful way to turn complex information into visuals that US audiences love to read and share. With the right approach, you can boost engagement, improve retention, and make your content stand out.
I’m Riten, founder of Fueler, a platform that helps freelancers and professionals get hired through their work samples. In this article, I’ll show you how to create infographics that resonate with US audiences. Remember, it’s not just about the visuals your infographic is your proof of expertise, your credibility, and your shortcut to trust.
1. Know Your Audience
Understanding your target audience is the first step in creating effective infographics. Research their demographics, interests, and pain points to make your content relevant and engaging. Use analytics and surveys to gain insights into what your audience cares about most.
- Analyze age, location, and preferences
- Identify common questions and challenges
- Tailor your tone and design to audience expectations
- Use relatable examples and data
Why it matters: Knowing your audience ensures your infographic speaks directly to their needs, increasing engagement and shareability.
2. Define Your Message and Objective
A clear message is the backbone of any successful infographic. Decide what you want to communicate and what action you want your audience to take after viewing your infographic. This focus will guide your design and content choices.
- Set a specific goal for your infographic
- Craft a concise, compelling message
- Align visuals with your objective
- Avoid unnecessary information
Why it matters: A focused message helps your infographic deliver value, making it memorable and actionable.
3. Gather and Organize Your Data
Collect accurate, up-to-date data that supports your message. Organize your information logically, making it easy for viewers to follow the story. Prioritize quality over quantity to avoid overwhelming your audience.
- Use reputable sources and double-check facts
- Group related data points together
- Highlight the most important statistics
- Create a logical flow from start to finish
Why it matters: Well-organized data builds trust and makes your infographic easy to understand.
4. Choose the Right Visual Format
Pick a visual format that fits your data and message. Options include charts, graphs, timelines, maps, and illustrations. The right format will make your information clear and visually appealing.
- Match visual style to your content type
- Use colors and icons for clarity
- Keep design consistent and on-brand
- Test different layouts for impact
Why it matters: Choosing the right format helps your audience absorb information quickly and remember it longer.
5. Design with Templates and Tools
Use infographic templates and design tools to save time and maintain a professional look. Platforms like Venngage, Canva, and Infogram offer customizable templates, icons, and charts designed for US audiences.
- Access a variety of ready-made templates
- Customize fonts, colors, and images
- Drag-and-drop design for easy editing
- Export in multiple formats for sharing
Why it matters: Templates and tools make infographic creation accessible, even for beginners, ensuring your visuals look polished and engaging.
6. Add Style and Branding
Enhance your infographic with unique style elements and consistent branding. Use your brand colors, fonts, and logo to reinforce your identity and make your infographic stand out.
- Incorporate brand elements throughout the design
- Use consistent color schemes and typography
- Add illustrations or icons for personality
- Keep the layout clean and uncluttered
Why it matters: Strong branding increases recognition and trust, encouraging your audience to share your content.
7. Review and Optimize for Clarity
Before publishing, review your infographic for accuracy, clarity, and visual appeal. Ask others for feedback and make adjustments as needed. Optimize file size and format for fast loading on all devices.
- Proofread text and double-check data
- Simplify complex visuals
- Test readability on different screens
- Compress files for web use
Why it matters: A clear, error-free infographic builds credibility and ensures your message is understood.
8. Promote and Share Your Infographic
Share your infographic across social media, blogs, and email newsletters to reach a wider audience. Use relevant keywords, hashtags, and descriptions to improve discoverability and SEO.
- Post on platforms like LinkedIn, Instagram, and Twitter
- Embed in blog posts and landing pages
- Encourage sharing with easy-to-use links
- Track performance with analytics
Why it matters: Promotion maximizes your infographic’s reach, helping you attract more views, shares, and engagement.
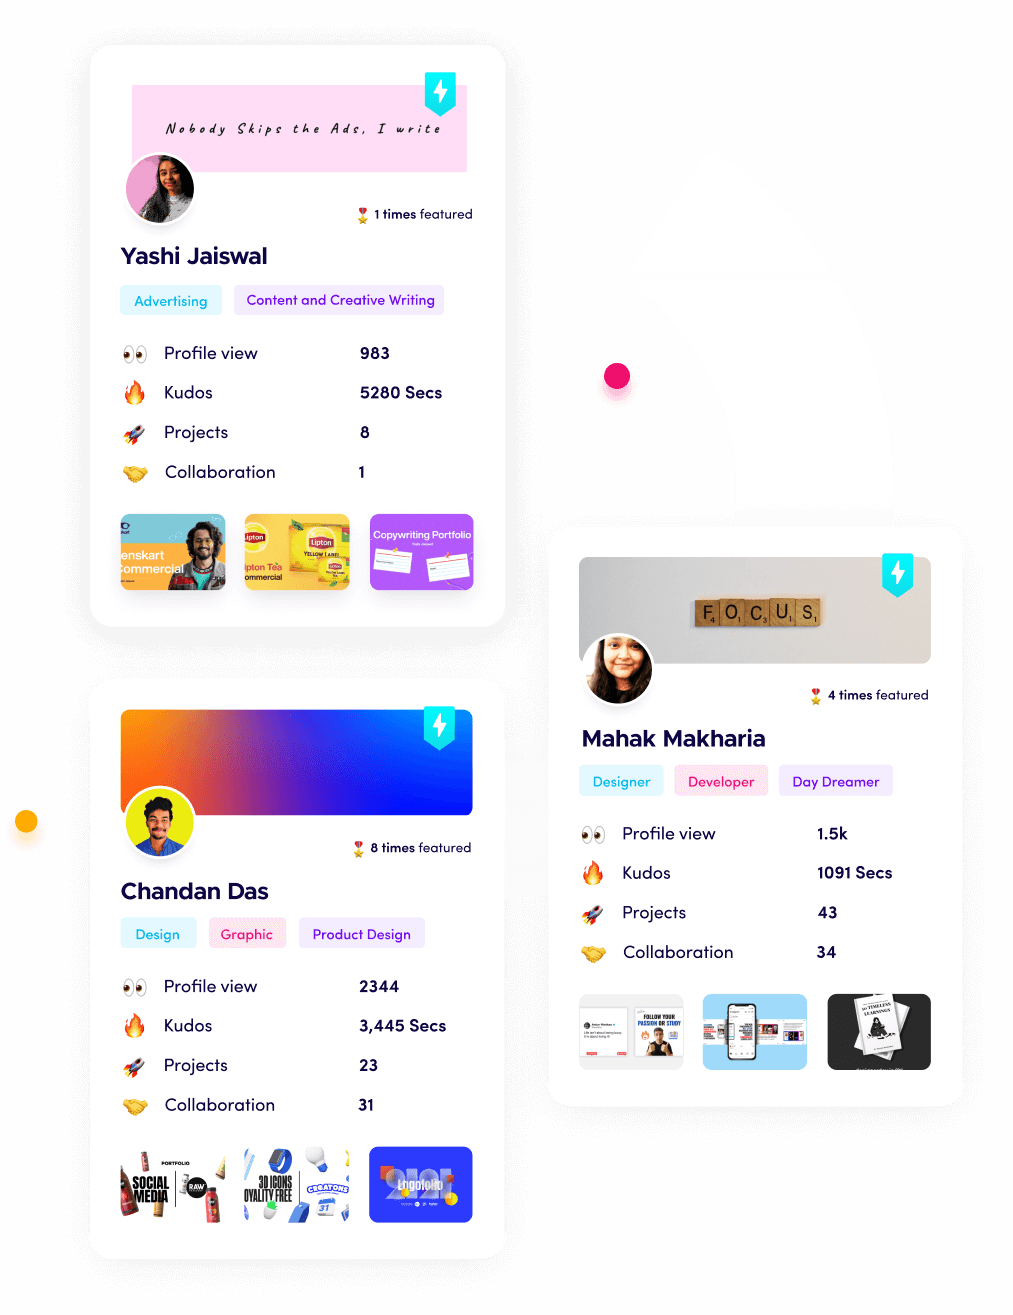
Fueler: Show Off Your Infographic Skills
If you want to get noticed for your infographic design skills, showcase your best work on Fueler. Our platform lets you build a portfolio of real projects, helping you land more clients and prove your expertise through assignment-based hiring.
Final Thought
Infographics are a powerful way to communicate complex ideas and capture attention. By following these steps, you can create visuals that inform, engage, and inspire US audiences helping you stand out in a crowded digital world.
FAQs
1. What is the best tool for creating infographics for US audiences?
Venngage, Canva, and Infogram are all excellent for easy, professional infographic design.
2. How do I choose the right data for my infographic?
Focus on accurate, up-to-date, and relevant data that supports your main message.
3. Can I use infographics for marketing in the US?
Yes, infographics are highly shareable and effective for content marketing and brand awareness.
4. How do I make my infographic more engaging?
Use clear visuals, strong branding, and a focused message to capture attention.
5. What are common mistakes to avoid in infographic design?
Avoid clutter, unclear data, inconsistent branding, and lack of a clear message.
What is Fueler Portfolio?
Fueler is a career portfolio platform that helps companies find the best talents for their organization based on their proof of work.
You can create your portfolio on Fueler, thousands of freelancers around the world use Fueler to create their professional-looking portfolios and become financially independent. Discover inspiration for your portfolio
Sign up for free on Fueler or get in touch to learn more.

What should you do next?
You've read the article. Now turn your skills into proof of work and unlock more opportunities.
Build your proof of work portfolio
Create a clean portfolio with projects, assignments, resumes, and AI stack details that companies actually want to see.
Create your Fueler portfolio →Apply through assignments, not resumes
Stand out by solving real tasks from companies hiring on Fueler.
Explore assignments →Get discovered by companies
Make your work public and let recruiters discover your skills through actual projects instead of keywords.
Get discovered →